Improving your debug with DebuggerDisplay
There is an amazing and easy to use custom attribute on .NET Framework stack that I rarely see in use. It helps and improve the way you can debug your code and you just need a line of code to use it: DebuggerDisplay.
Maybe you’ve used it a lot and already love it, in this case just spread the word ;), but if you are a beginner or an experienced .NET developer and don’t know DebuggerDisplay, this is the chance to you to improve your debug skills.
Imagine this scenario:
We have a class called Tweet:
public class Tweet
{
    public string Text { get; set; }
    public User User { get; set; }
    public int RetweetsCount  { get; set; }
    public int FavoritesCount  { get; set; }
}
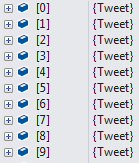
You are debugging a list of Tweets, let me say 200 tweets, and all tweets in the debugger view looks like the image below:

It’s clear that is not easy to know what tweets are inside that list. Of course you can use breakpoint conditions, trace, logs and many others resources to help the debug process, but DebuggerDisplay is an easier and very cheap solution.
In our scenario, the most important things about the Tweet class are the text, the username and the retweets count. We’ll add the DebuggerDisplay attribute to the class:
[DebuggerDisplay("{Text} ({User.UserName}) - RTs: {RetweetCount}")]
public class Tweet
{
    public string Text { get; set; }
    public User User { get; set; }
    public int RetweetsCount  { get; set; }
    public int FavoritesCount  { get; set; }
}
Now, that “secret” tweet list looks like:


When debugging is easier than expected
More information about DebuggerDisplay on official documentation: msdn.microsoft.com/en-us/library/ms228992(v=vs.110).aspx